


How meritorious is the National Merit Scholarship?
A statistical analysis of the racial and gender biases introduced by the NMSC's new scoring system

The National Merit Scholarship Competition/Corporation/Program is something, though I’m not sure exactly what.
It’s not a scholarship itself, but there are scholarships involved. If you score well on the Preliminary SAT / National Merit Scholarship Qualifying Test (PSAT NMSQT, “pee-sat num-squat”), you get your name published in the paper1 and become eligible for all sorts of financial awards.
Some of them come from the NMSC/C/P itself, others from corporate partners—and some colleges offer scholarships through the NMSC/C/P, while others offer them independently to students who’ve achieved various honors in the NMSC/C/P.
Right, there are a few levels of honors:
Commended
About 50,000 students get (at least) Commended status—they have to score above a single, national cut-off on the PSAT NMSQT. They don’t get to compete for any extra scholarships.
Semifinalist
About 16,000 of the Commended-level students get to be National Merit Semifinalists instead—they have to score above a higher, varying-by-state cut-off. Achieving this level will get colleges like UTulsa to give you a full ride and Fordham to give you a full-tuition scholarship.
Finalist
All the semifinalists can become finalists—they have to score at least fairly well on the SAT, and they have to submit an application with a personal essay. About 15,000 of the 16,000 make it. If you get here, you’ve earned a full (and perky) ride from UT Dallas or UAlabama.
Scholar/awardee/Nationally Meritorious Person
There’re 2,500 $2,500 scholarships from the NMSC/C/P itself; about 4,000 from colleges, ranging from $500-$2500 (sometimes they renew each year); and 1,000 more from corporate sponsors (often just available to children of employees). About half of finalists end up winning one of these types of awards (you’re limited to one).
There’s a long timeline for all of this, and all that’s happened so far this year is the announcement of the semifinalists.
One extra wrinkle before I show you all my cool numbers and charts: in the fall of 2023, the College Board made a switch to a digital format for the PSAT NMSQT (they design and administer the test, but are separate from the NMSC/C/P).
The previous version of the test had three sections: Reading, ‘Riting, and ‘Rithmetic (“Math”). The new version combined the Reading and ‘Riting sections into the ‘ERW’,2 but left Math alone.
The NMSC/C/P decided that instead of revising their scoring metric to evenly weight the ERW and Math sections, they wanted to keep their previous balance where Reading, ‘Riting, and ‘Rithmetic all had equal shares.
So the NMSC/C/P’s ‘Selection Index’ is calculated like so:
Why divide by 10? Because all of the College Board’s test scores come in multiples of 10, and now I think about it, that’s insane, why aren’t the SATs scored out of 160? Or better yet, 100?? Why can’t they just be normal???
Anyway. The NMSC/C/P is being weird, and weighting the ERW section twice as much as Math. They can come up with whatever ‘oooh, Language is so important’ justifications they want, but it’s still weird.
The College Board changed the test because they realized Reading & ‘Riting are basically the same skill—they’d been combining them into the same section score all this time anyways; it’s never made sense nor been common psychometric practice to double-count the largely-singular skill of ‘Language’.
Everybody always loves to talk about the racial and gender biases of IQ-adjacent tests, particularly the SAT. And they do so famously uncontroversially, with loving care and kindness for everyone’s perspective.
Why not join in this illustrious intellectual tradition?
We know that there are stark racial performance gaps on basically all tests like the PSAT NMSQT. This is not because they’re racist tests; it’s maybe because society is still racist; probably because society was previously racist for a while; and really-almost-certainly-not because Whites (and especially Asians) are naturally smarter than everyone else.
There are also big-time differences between the sorts of fields that men and women go into—men tend to dominate STEM, women the humanities. This is mostly explained by the fact that women show lower interest in STEM on average. Additionally, although women and men are equally smart on average, men show more variance: meaning most very very dumb people are men, and so are most very very smart people.4
All this to say: there’s lots of data out there on gender and racial differences in test performance, and society clearly has a strong interest in understanding those differences.
Well, I serve at the pleasure…
The College Board publishes a somewhat-detailed report on all of their tests every year, so I took a look at the 2023 PSAT NMSQT data.5 The first thing I found was confirmation of a small, but seemingly-significant, difference between genders in the ERW and Math sections.6

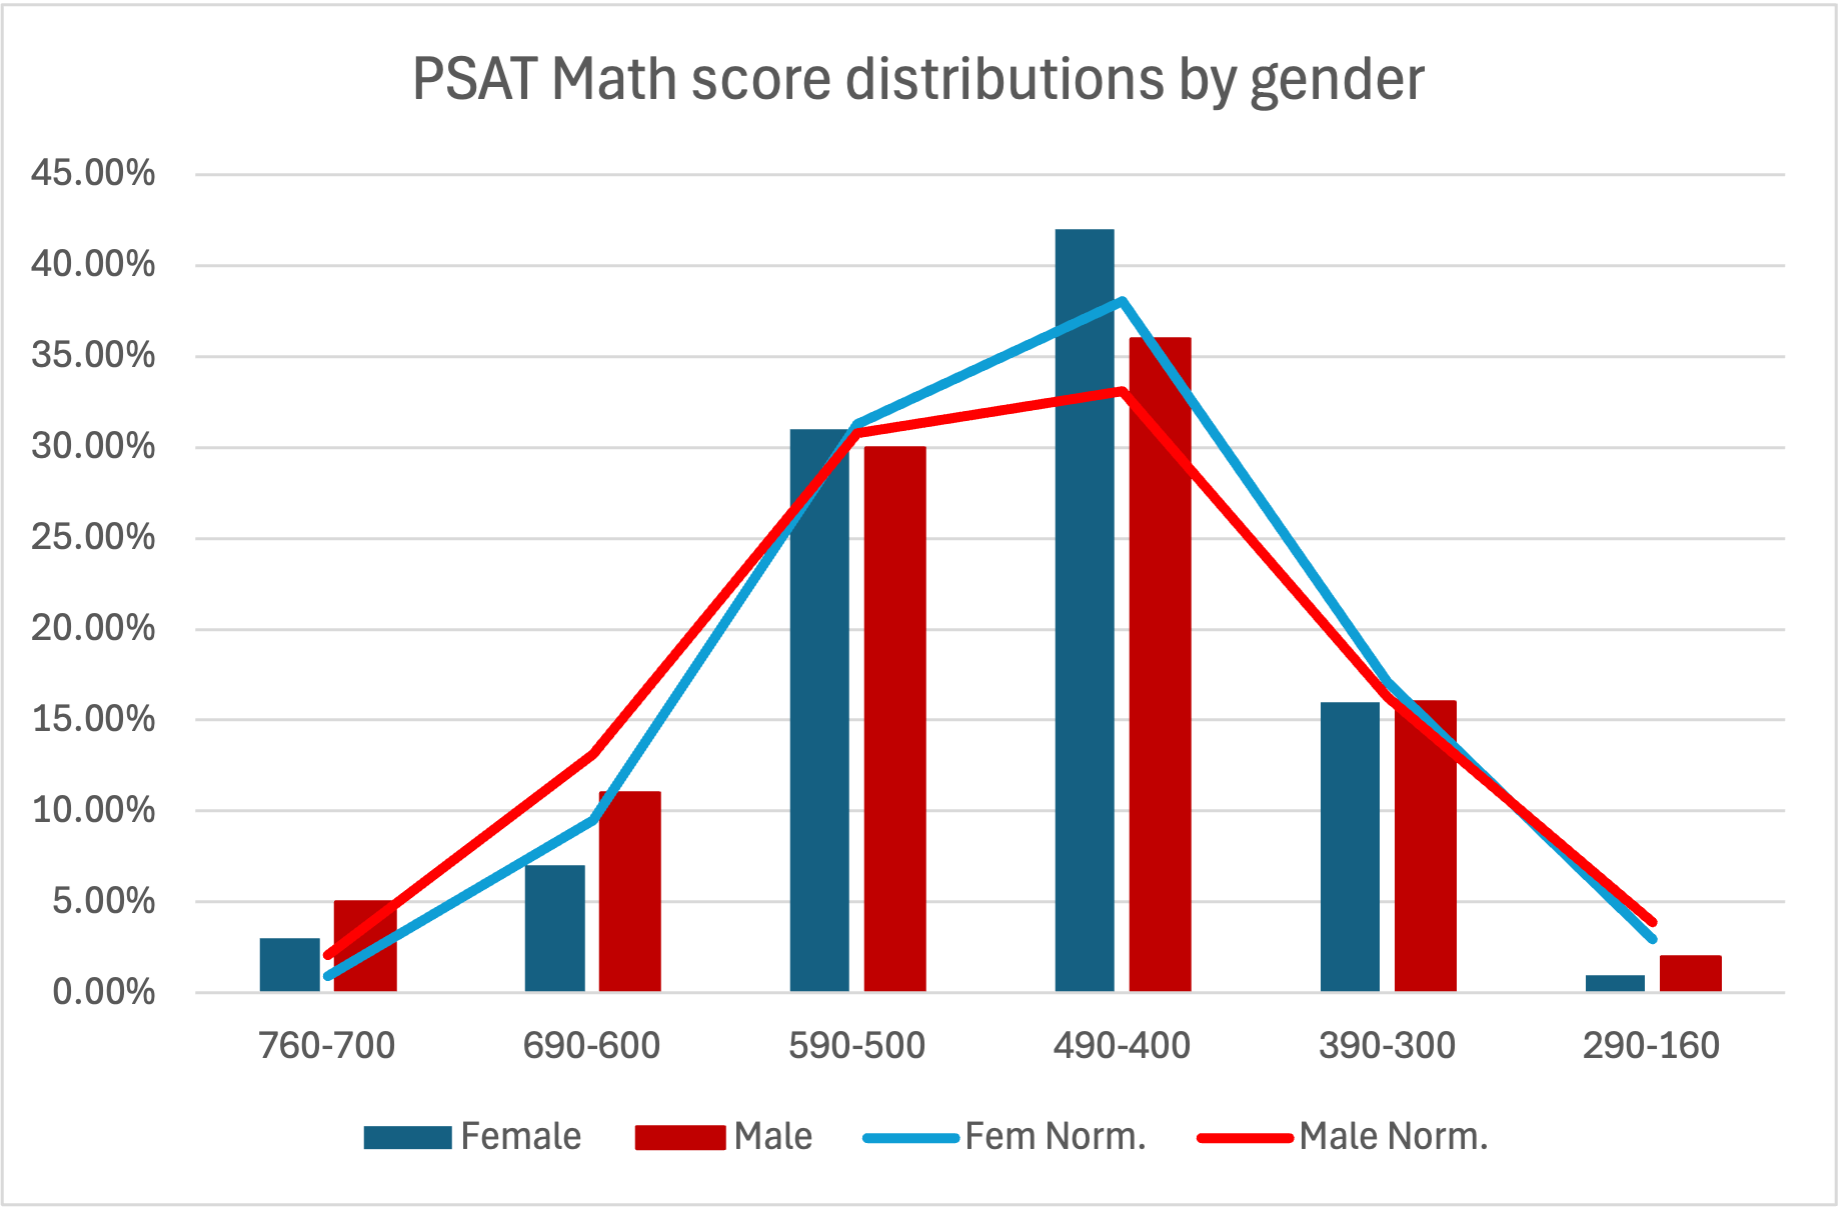
This is mostly in alignment with what we’d expect based on differing interests.
Further, if we look at total scores on the test, we can see that male students do show (slightly) greater variation than female:
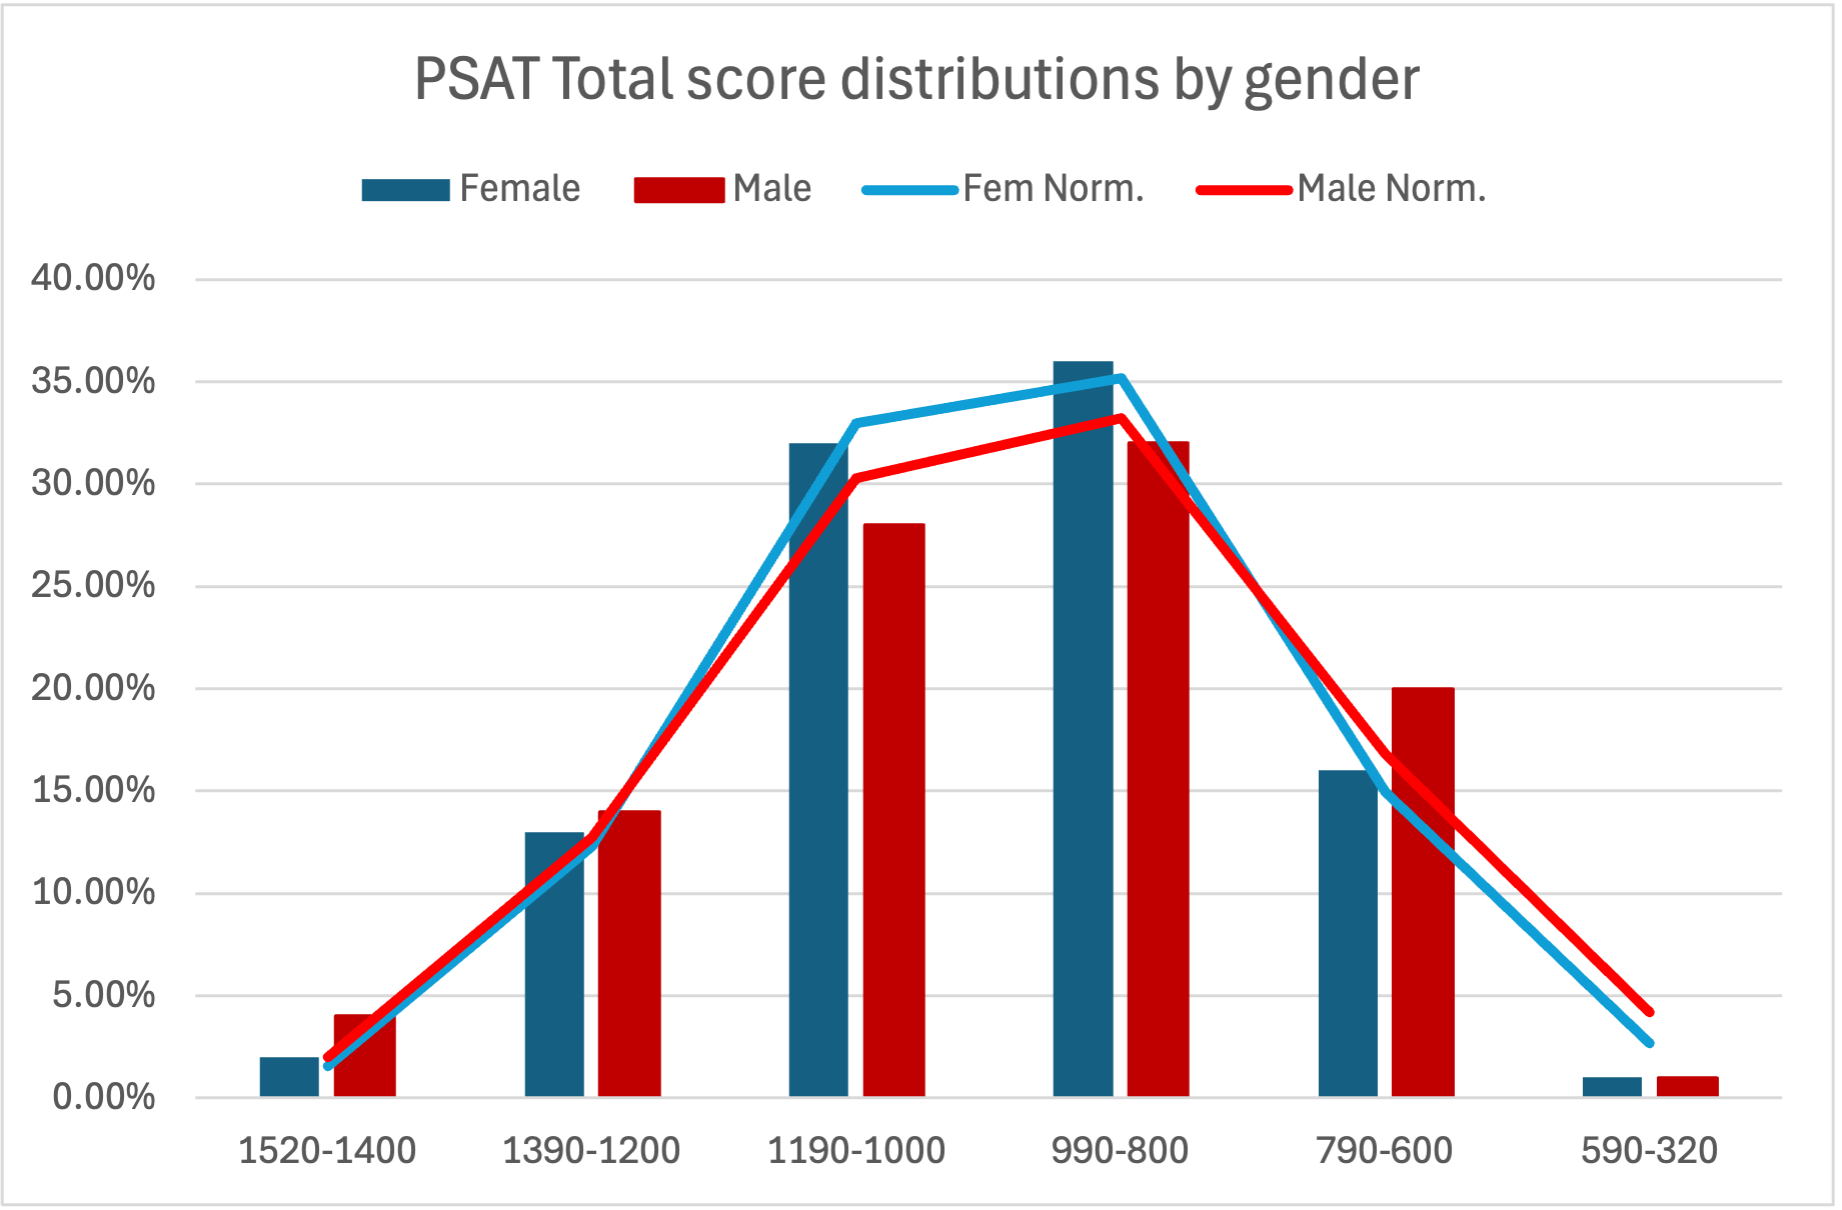
Female students score ~1% higher, but male students’ scores vary about 10% more than female students’. 10% feels significant, no?
Well, it’s significant enough that the top bands of achievement on the test as a whole look like this:

Nearly 70% of the highest-scoring students are male, though the next band is closer to 50-50. This is interesting (and, again, expected), but what we’re after is the comparison to the NMSC/C/P’s Selection Index.
Unfortunately, the NMSC/C/P don’t publish any of their data publicly. Meaning I have to do lots of fancy statistical propagation to get the distribution of Selection Indices.7 Lucky for you, I’m a dedicated man (who really doesn’t want to draft his college application essay and has no social life), so here we are:

Whoa! Nearly perfect parity!
The NMSC/C/P’s Selection Index—by mistake, by coincidence, or by intention—looks very very even across genders. Meaning it’s awarding Semifinalist and Commended status to about as many girls as boys—but also that it’s quite biased toward female students relative to the PSAT NMSQT itself.
Now for race.
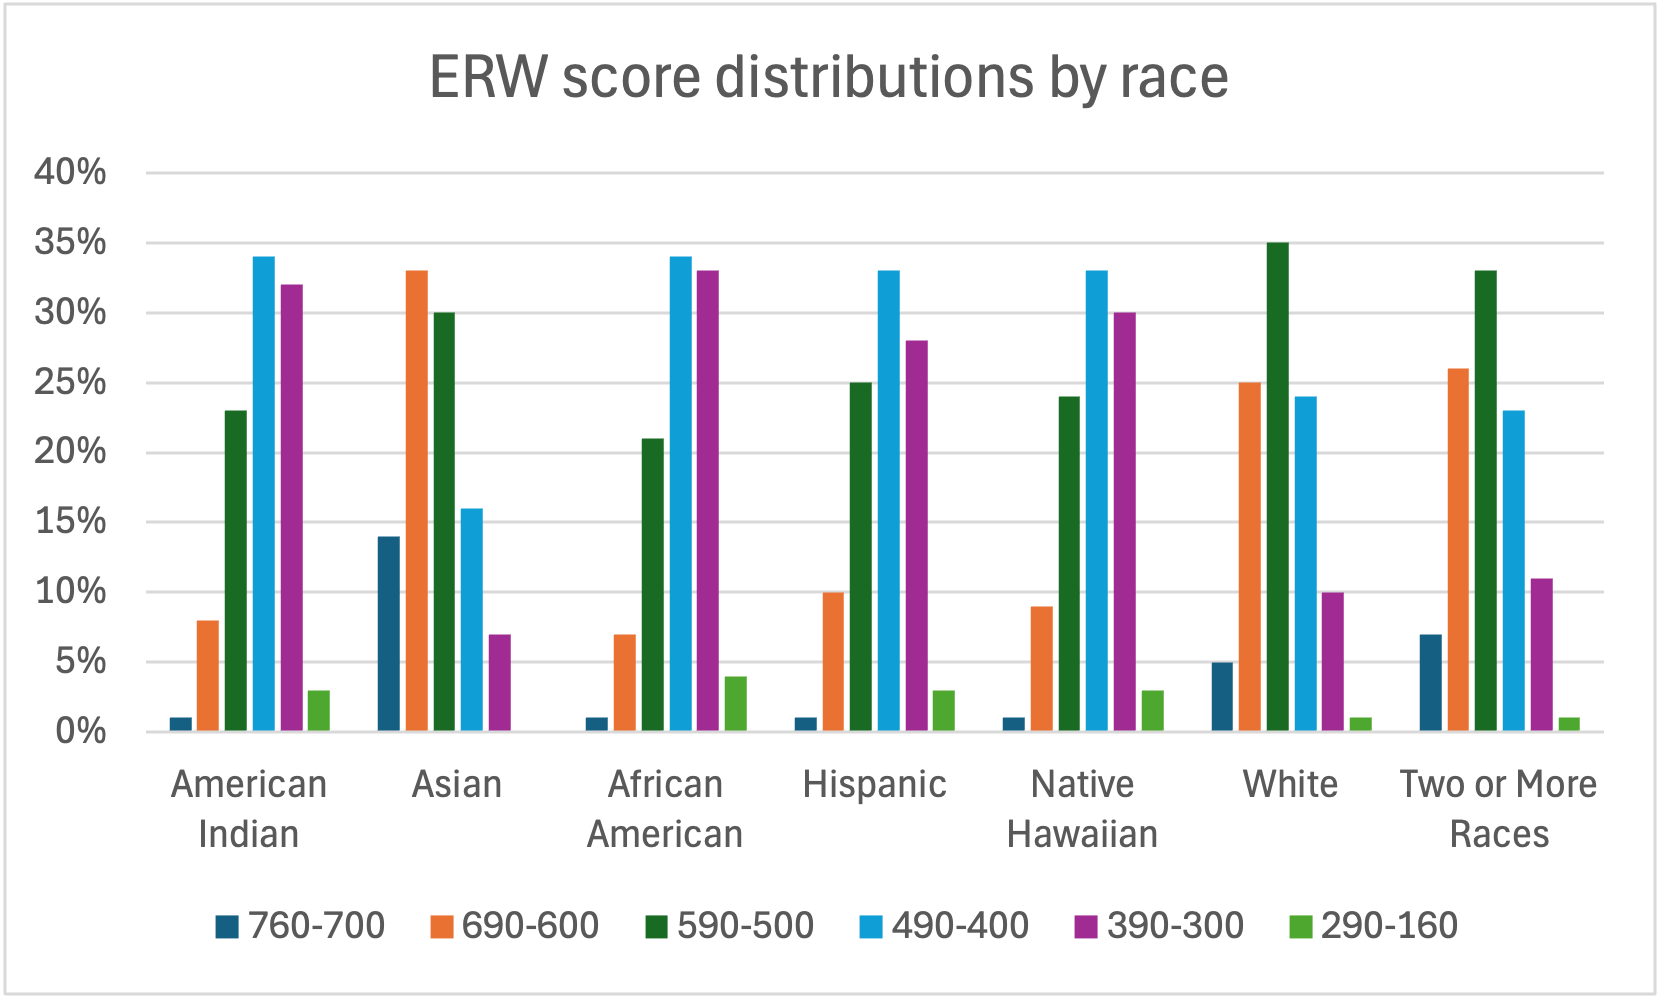
The College Board reports data for a ton of groups: American Indian, Asian, African American, Hispanic, Native Hawaiian, White, and Two or More Races. Here are the section score distributions for each:
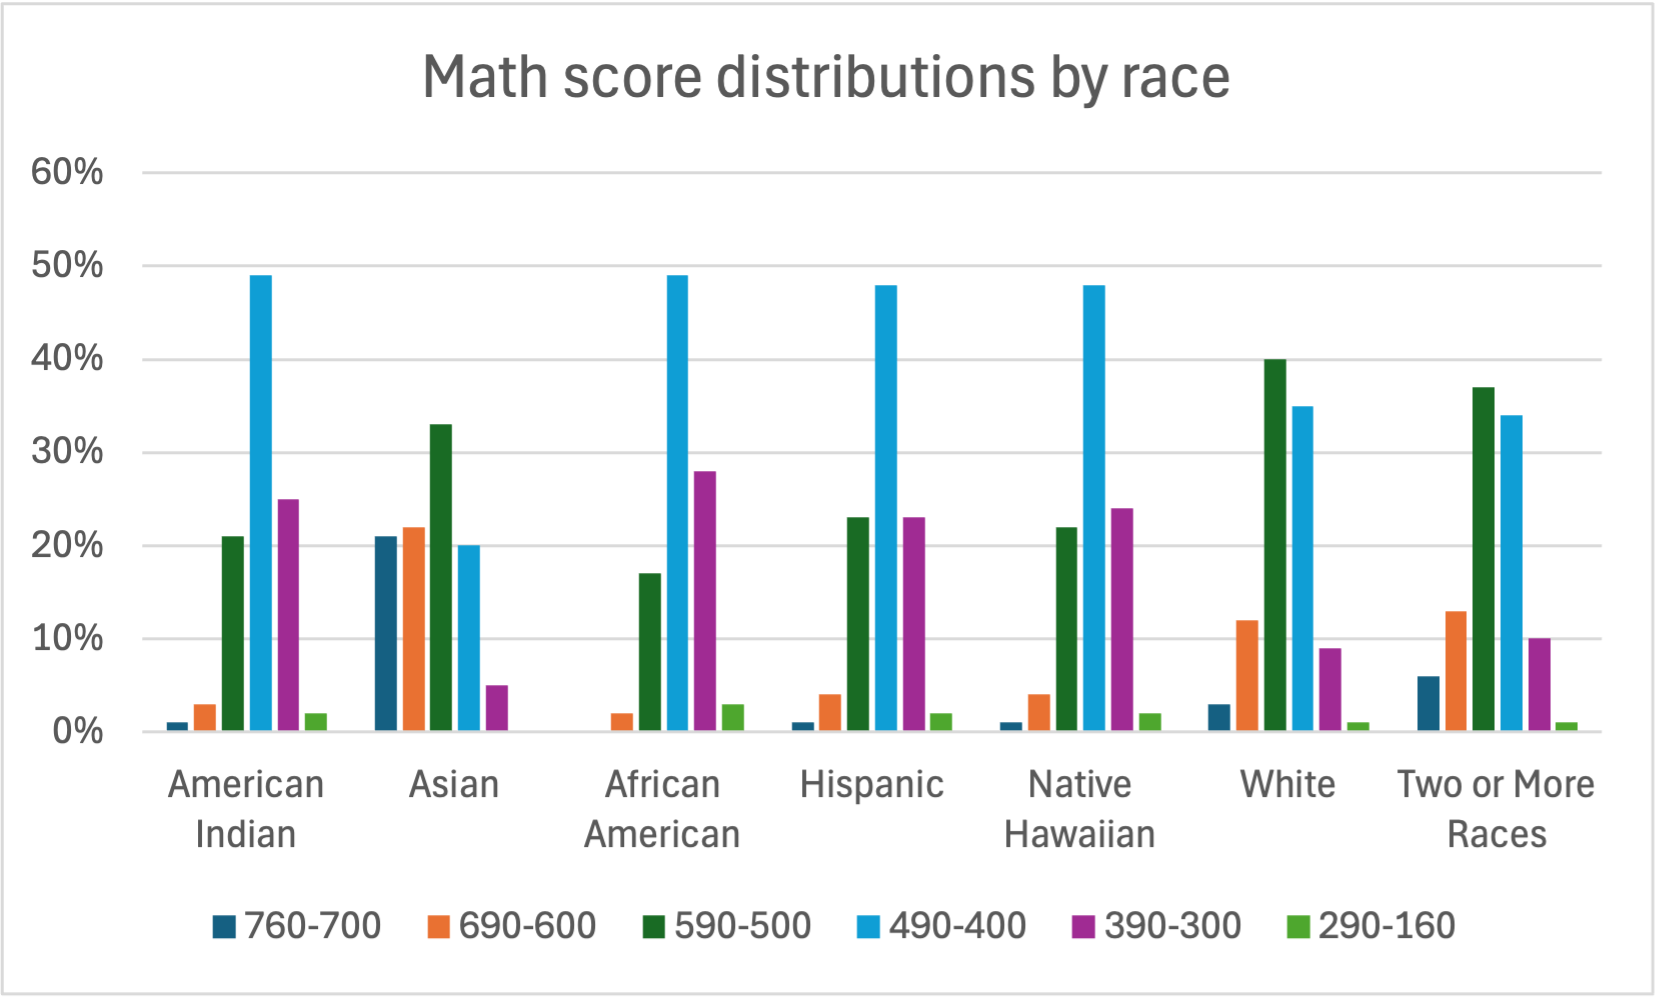
Obviously, Asians are the true master race.
Less obviously, Asians are weirdly better at Math than they are at ERW.
They average a 585.3 on Math, but only a 578.2 on ERW. That’s just a 1.2% drop—but compare it to Whites: they score 511.2 on Math, but that shoots up to a 536.8 on ERW, a 5% increase.
Students who identified with ‘Two or More Races’ similarly saw a 4.6% higher ERW score than Math. These are small differences, but they put Asians at a real disadvantage in the NMSC/C/P’s Selection Index. Sure enough:


Asians are still a dominant force at the top of the Selection Index distribution—but they lose significant ground to Whites, multiracials, and American Indians at the very top; at the Semifinalist level. Notice also how African Americans, Hispanics, and Native Hawaiians are totally shafted by the NMSC/C/P’s double-focus on Language.
These results are probably statistically significant. I am not a professional or even very competent data guy—but Claude recommended I use a test of proportions,9 and the results are strong:
The male-female gender shift is significant p << 0.001. Male students make up ~2/3 of the top PSAT score band, but only 1/2 of the top NMSC/C/P Selection Index score band.
I couldn’t figure out how to do a test of proportions between all the races, but I did it between Asians and Whites.10 Again, the shift is significant p << 0.001. If we limit the sample to just these two races, 52% of top PSAT scorers are Asian and 48% are white. But only 35% of top NMSC/C/P Selection Index scorers are Asian, and 65% are White.
These results suggest that the NMSC/C/P policy is harmful to male and Asian students, and mostly to the benefit of females, Whites, and probably multiracials.
Perhaps the fine people at the NMSC/C/P truly, innocuously believe that Language deserves extra prominence in their decision-making: but the practice skews the rewards distinctively toward some groups (including Whites! Progressives, take notice…) and away from others.
Interestingly, those others—men and Asians—are the very groups often discriminated against by affirmative action schemes in higher ed. Coincidence? Yes, very possibly.
In any case, I suggest the NMSC/C/P scrap this nonsense. Let the test show what it shows, and reward merit as purely and impartially as they claim to.
I think the E is for Evidence, as in Evidence-Based, and I had thought that the SAT represented this section as ‘EBRW’. But the official College Board website only has it all spelled out as ‘Reading and Writing’ now; and the official College Board ‘annual report’ pdf has ‘ERW’. I’m gonna stick with ERW, because it’s what’s in my Excel sheet.
By ‘very very smart’ I mean ‘very very good at raw computation of the sort needed to excel at math, physics, computer science, etc.’ Also note: lots of women have made significant contributions to these fields (Lovelace, Hopper, Meitner, Curie, Hypatia…), but even in a perfectly gender-equal society, we shouldn’t be surprised to see ‘disproportionate’ representation of men (60-70+%) at the top of these fields.
This is the test that the recent Semifinalist announcement was all about.
These bar graphs also feature lines. These lines correspond to a normal distribution I created for the comparison to Selection Index scores… the fact that they fit the real data so nicely is good; please praise me and my statistical genius.
Fun fact: part of this propagation involves finding the correlation between the PSAT ERW and Math section scores. Since College Board doesn’t give very granular data, I accomplished this by comparing old PSAT Reading and Writing scores to ACT Math scores, and vice versa. I found those correlations in this paper, serendipitously prepared for my own home school district 9 years ago!
The numbers I’m using here are really weird. There aren’t as many Asians taking the test as Whites, so really their bar should be much smaller. However, the way I’ve done this is take the share of each racial group within a given score band; and the stacked bar represents how big each of those shares is.
I.e., since 15% of Asians scored in the top PSAT band and only 3% of Whites did, the Asian section of that stacked bar is 5 times larger. I admit this makes very little sense.
But! Since I’ve done the same thing for both the PSAT and the NMSC/C/P Selection Index, the comparisons I make and conclusions I draw are still valid. Just don’t expect half of National Merit Semifinalists to be Asian; that’s not what my data says.
Not a t-test because I don’t care much about differences in the various average scores. I care about the shift in gender and race shares at the top scoring bands.
I may have done this wrong… you can check all my calculations and mess around with the data I used if you download my Excel file from here.
To do this, I had to work back in the absolute number of test-takers in the top slice for each race, instead of the previous share-of-each-race.